Ecolibrium / Case Study
Helping industrial and commercial establishments optimise their energy consumption
See more about Ecolibrium and SmartSense Awards and Recognition

Windows Metro App for CXOs to monitor and manage power consumption of their establishment
The problem
For small and medium industries, energy consumption forms a significant chunk of their expenses. However, they do not have access to detailed analysis of their power utilisation patterns. Lack of this knowledge results in significant amount of energy wastage and mismanagement.
THE OPPORTUNITY
Ecolibrium Energy is an Ahmedabad based company making big leaps in the space of industrial energy and asset management. The idea is that if industries can affordably access their energy consumption data in real-time, they can take informed decisions in their operations to reduce their consumption and hence expenses significantly.
MY ROLE
I met the Ecolibrium energy team when it was a 3-people startup operating out of the incubator in IIM-Ahmedabad. My role with them was to lead the user experience and interface design of their flagship product- SmartSense. Confronted with a green-field, my job was to create a scalable and end to end UX vision that aligned well with their business model. Although the product has expanded and changed, I am always proud to be associated with the start of their journey.

One of my first ideation sessions with the founders of Ecolibrium, detailing the product and its components
SmartSense
A lightweight energy management suite that helps industries track and optimise their power consumption effectively
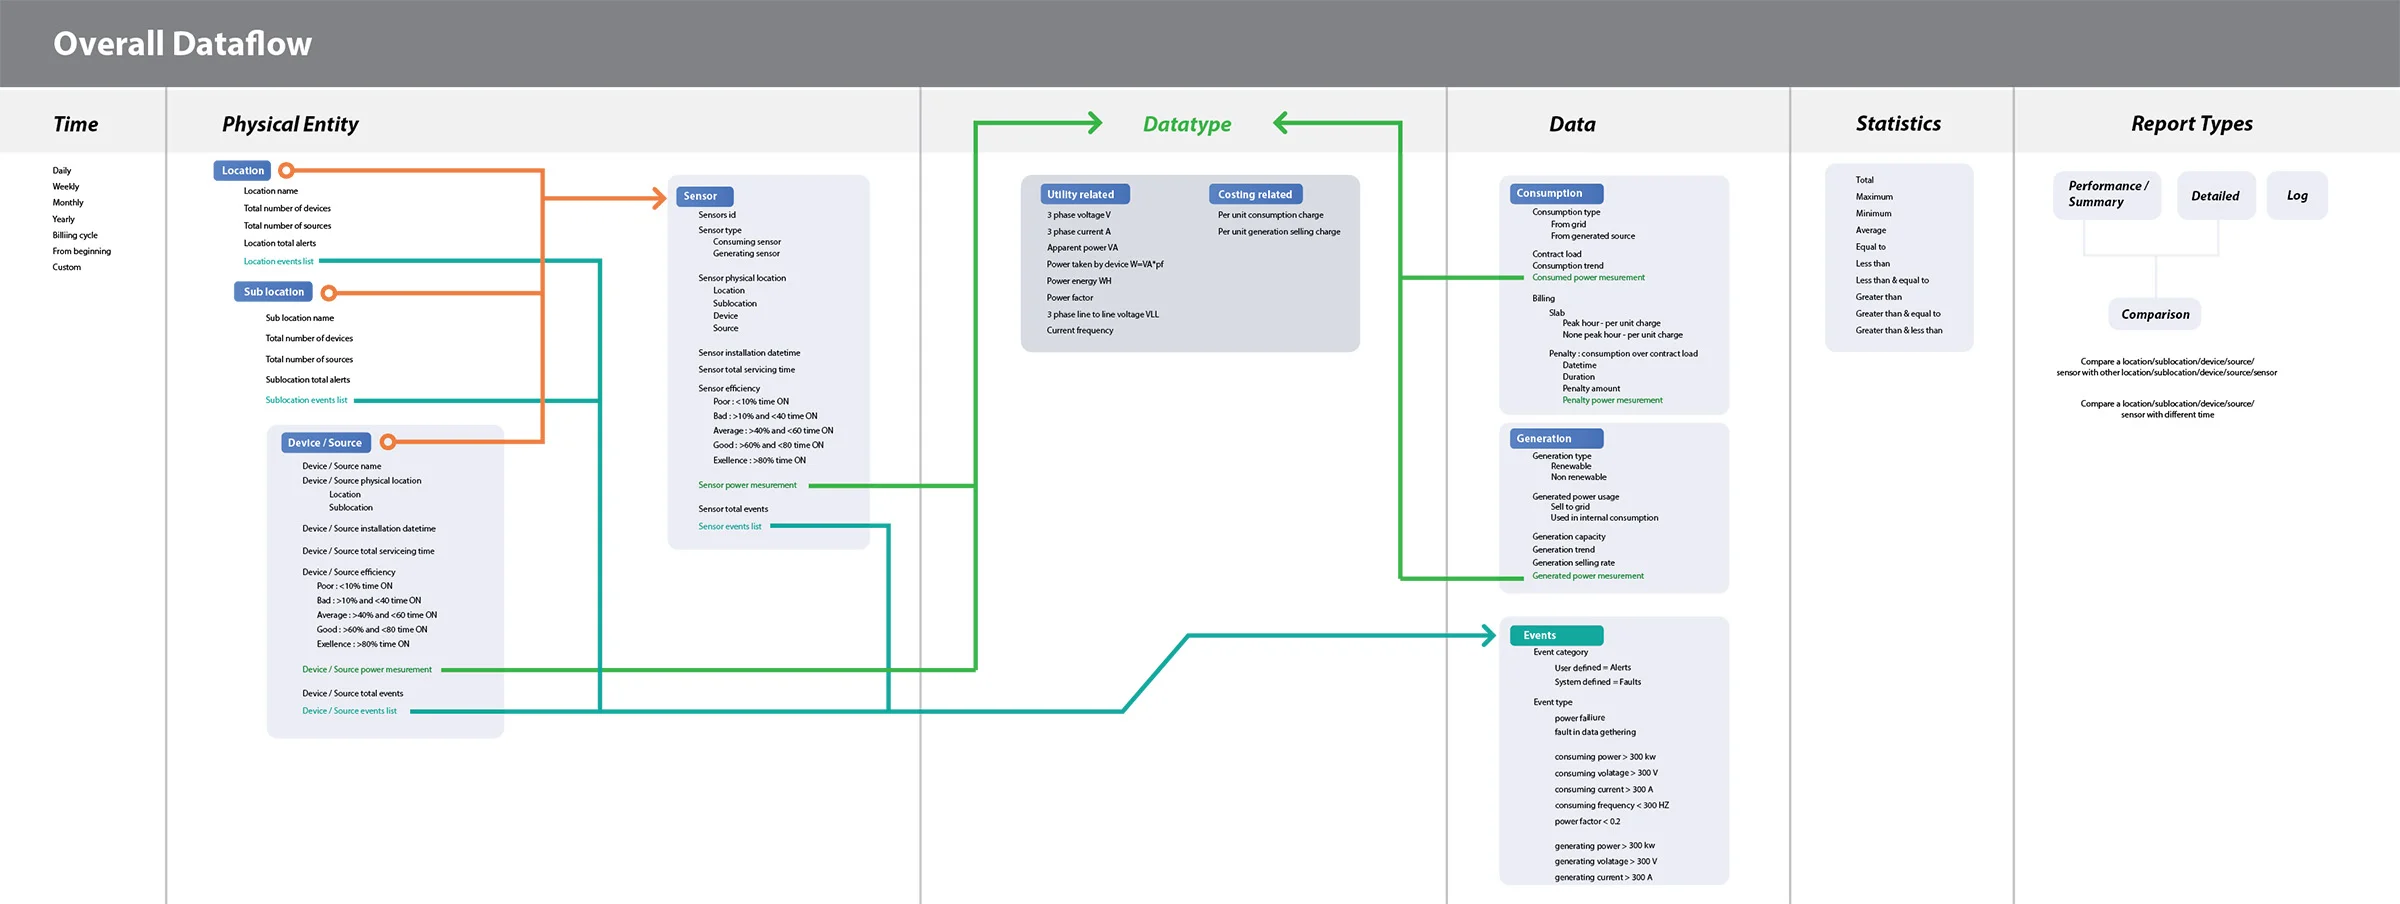
Understanding the different components of the system. One of my first tasks was to understand, visualize and contribute to the overall architecture of the system.
The idea was to build a suite of web and mobile apps for different levels of stakeholders in a typical industrial establishment, from a CXO-decision maker to a technician. The goal was to help industries easily visualise patterns of their power consumption and identify / suggest opportunities to optimise. For example : Could the system tell them : Save 30% on your energy bill by running your sewage treatment plant during the night when the unit costs are lower?

organizing information and creating efficient workflows
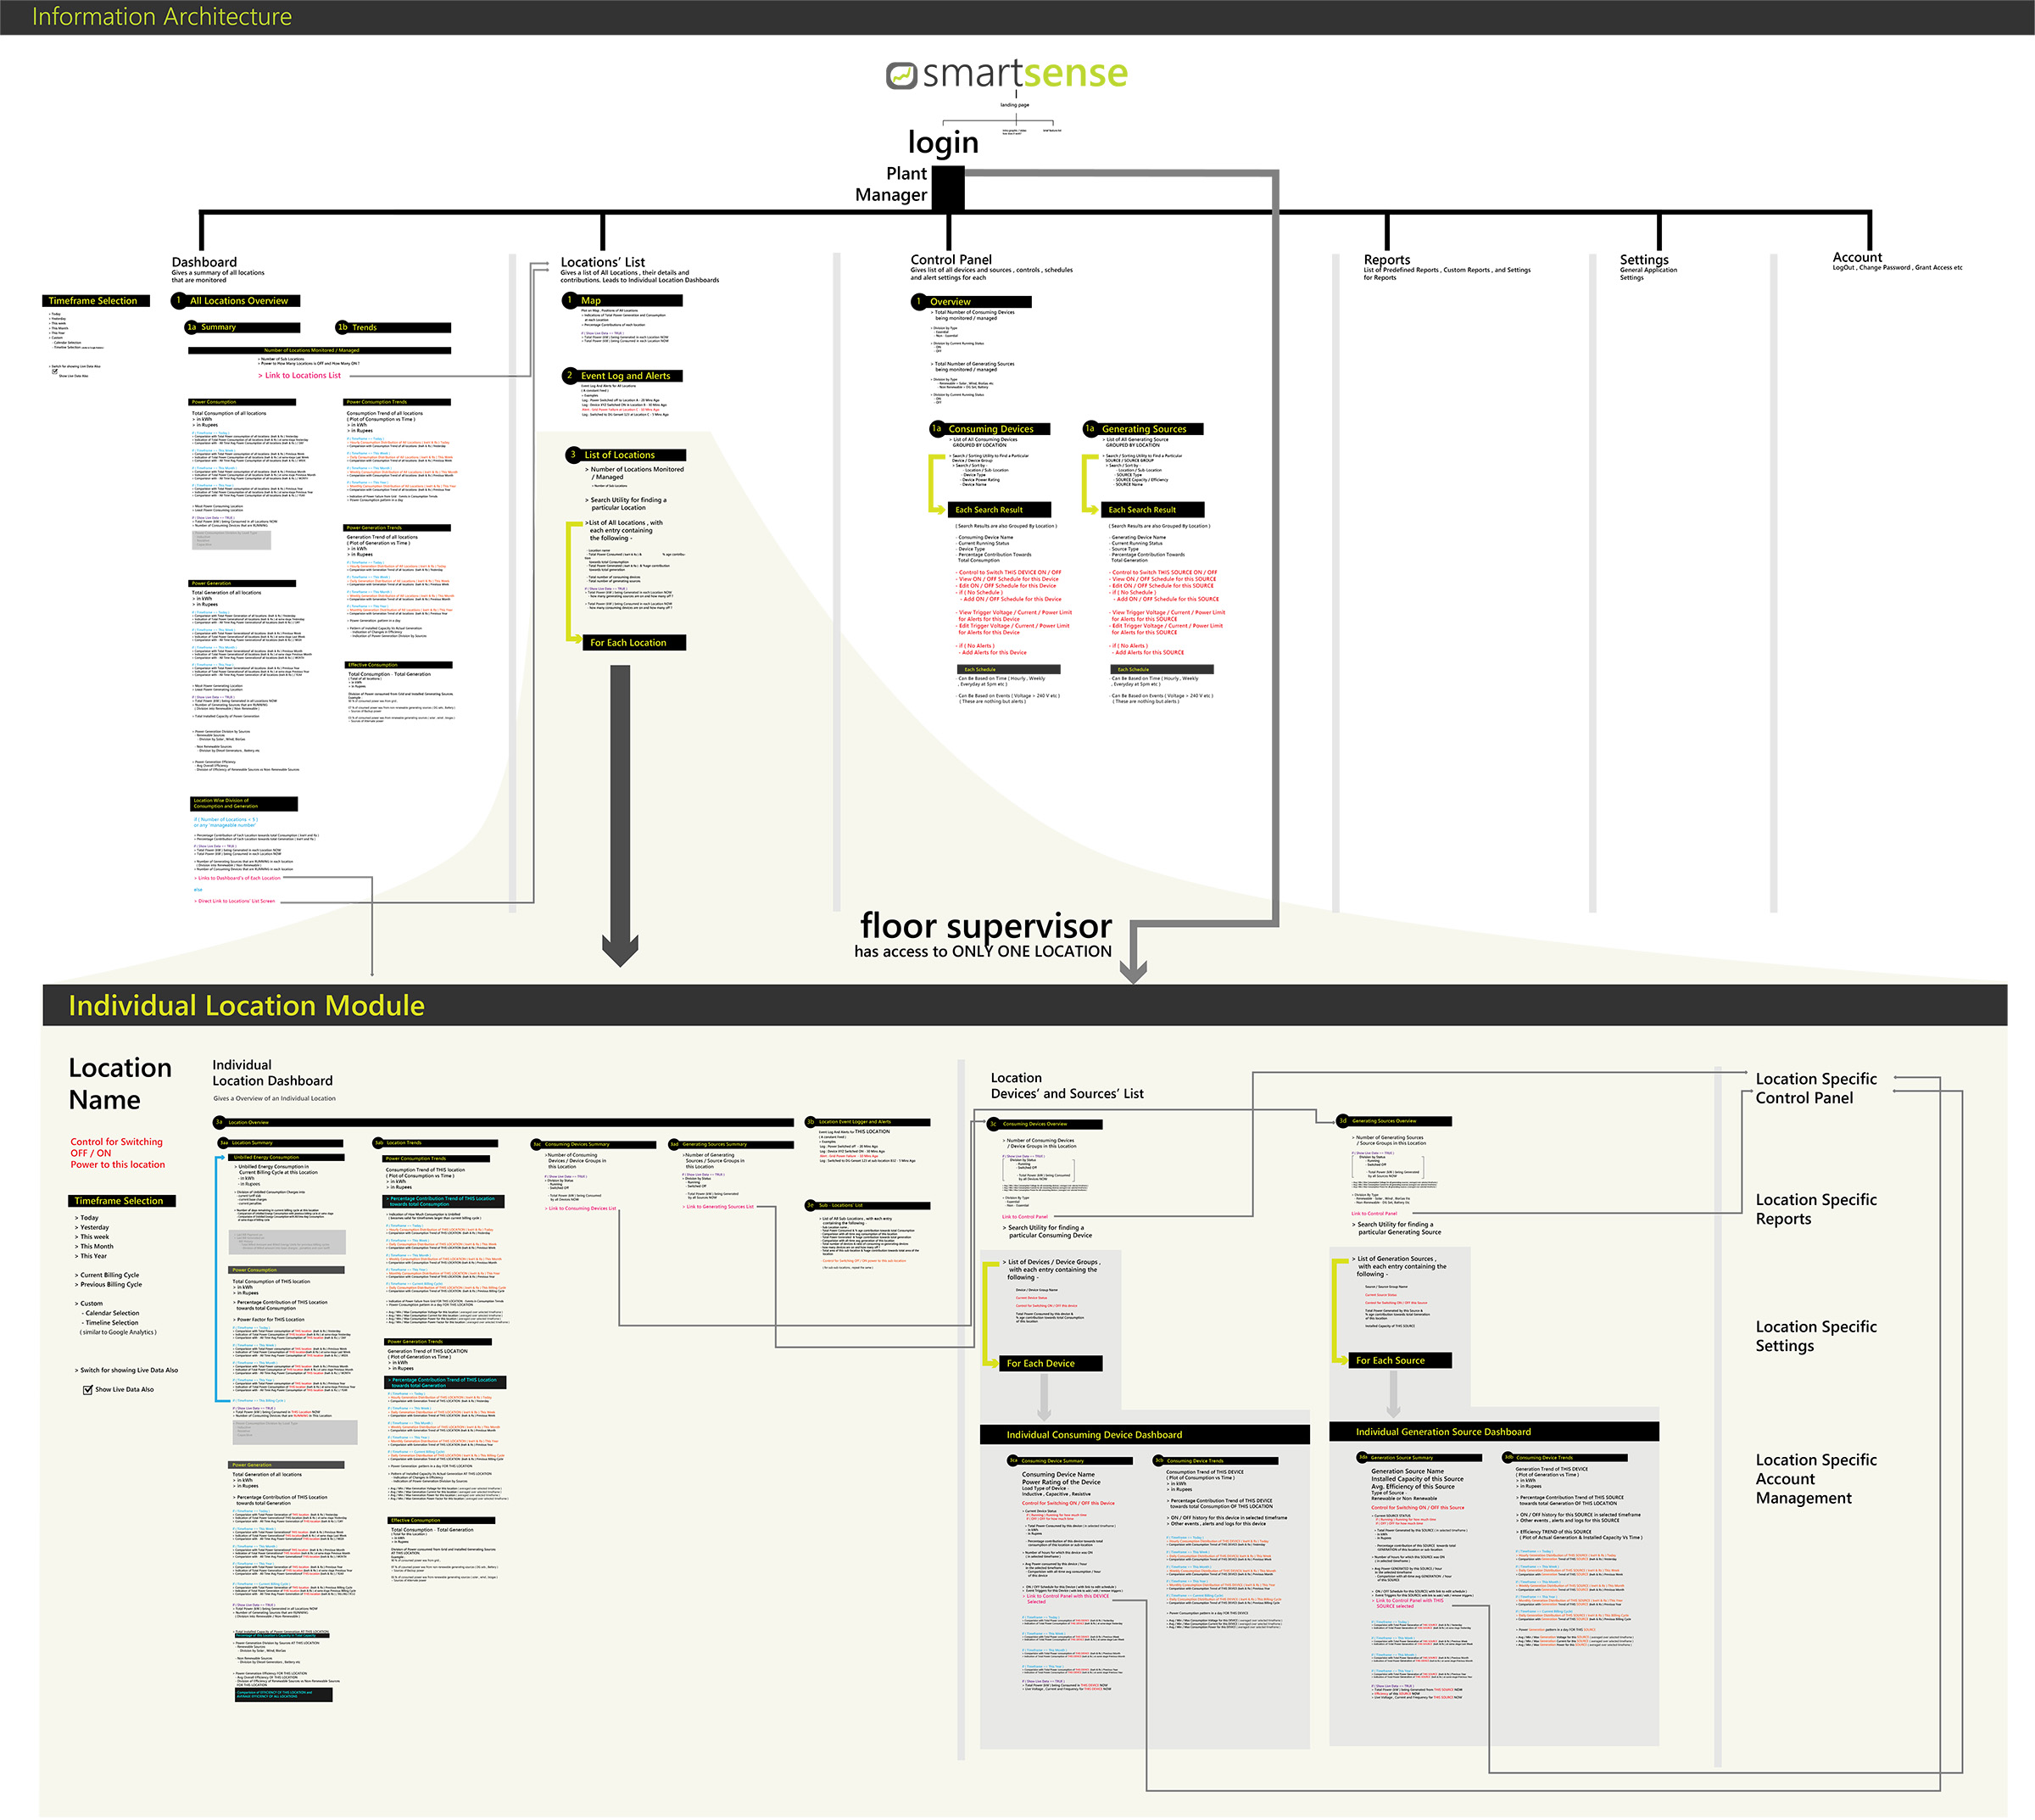
One of the the most important tasks upfront was to create an extensive and complete information architecture. The information architecture ensured that different stakeholders had access to the most relevant information for them readily. SmartSense sensors produced an overwhelmingly complex amount of data and it was critical at this stage to design workflows and navigation that progressively disclosed necessary and relevant information.
Evolution of the smartsense UI
Creating the SmartSense user interface involved multiple iterations and concept explorations

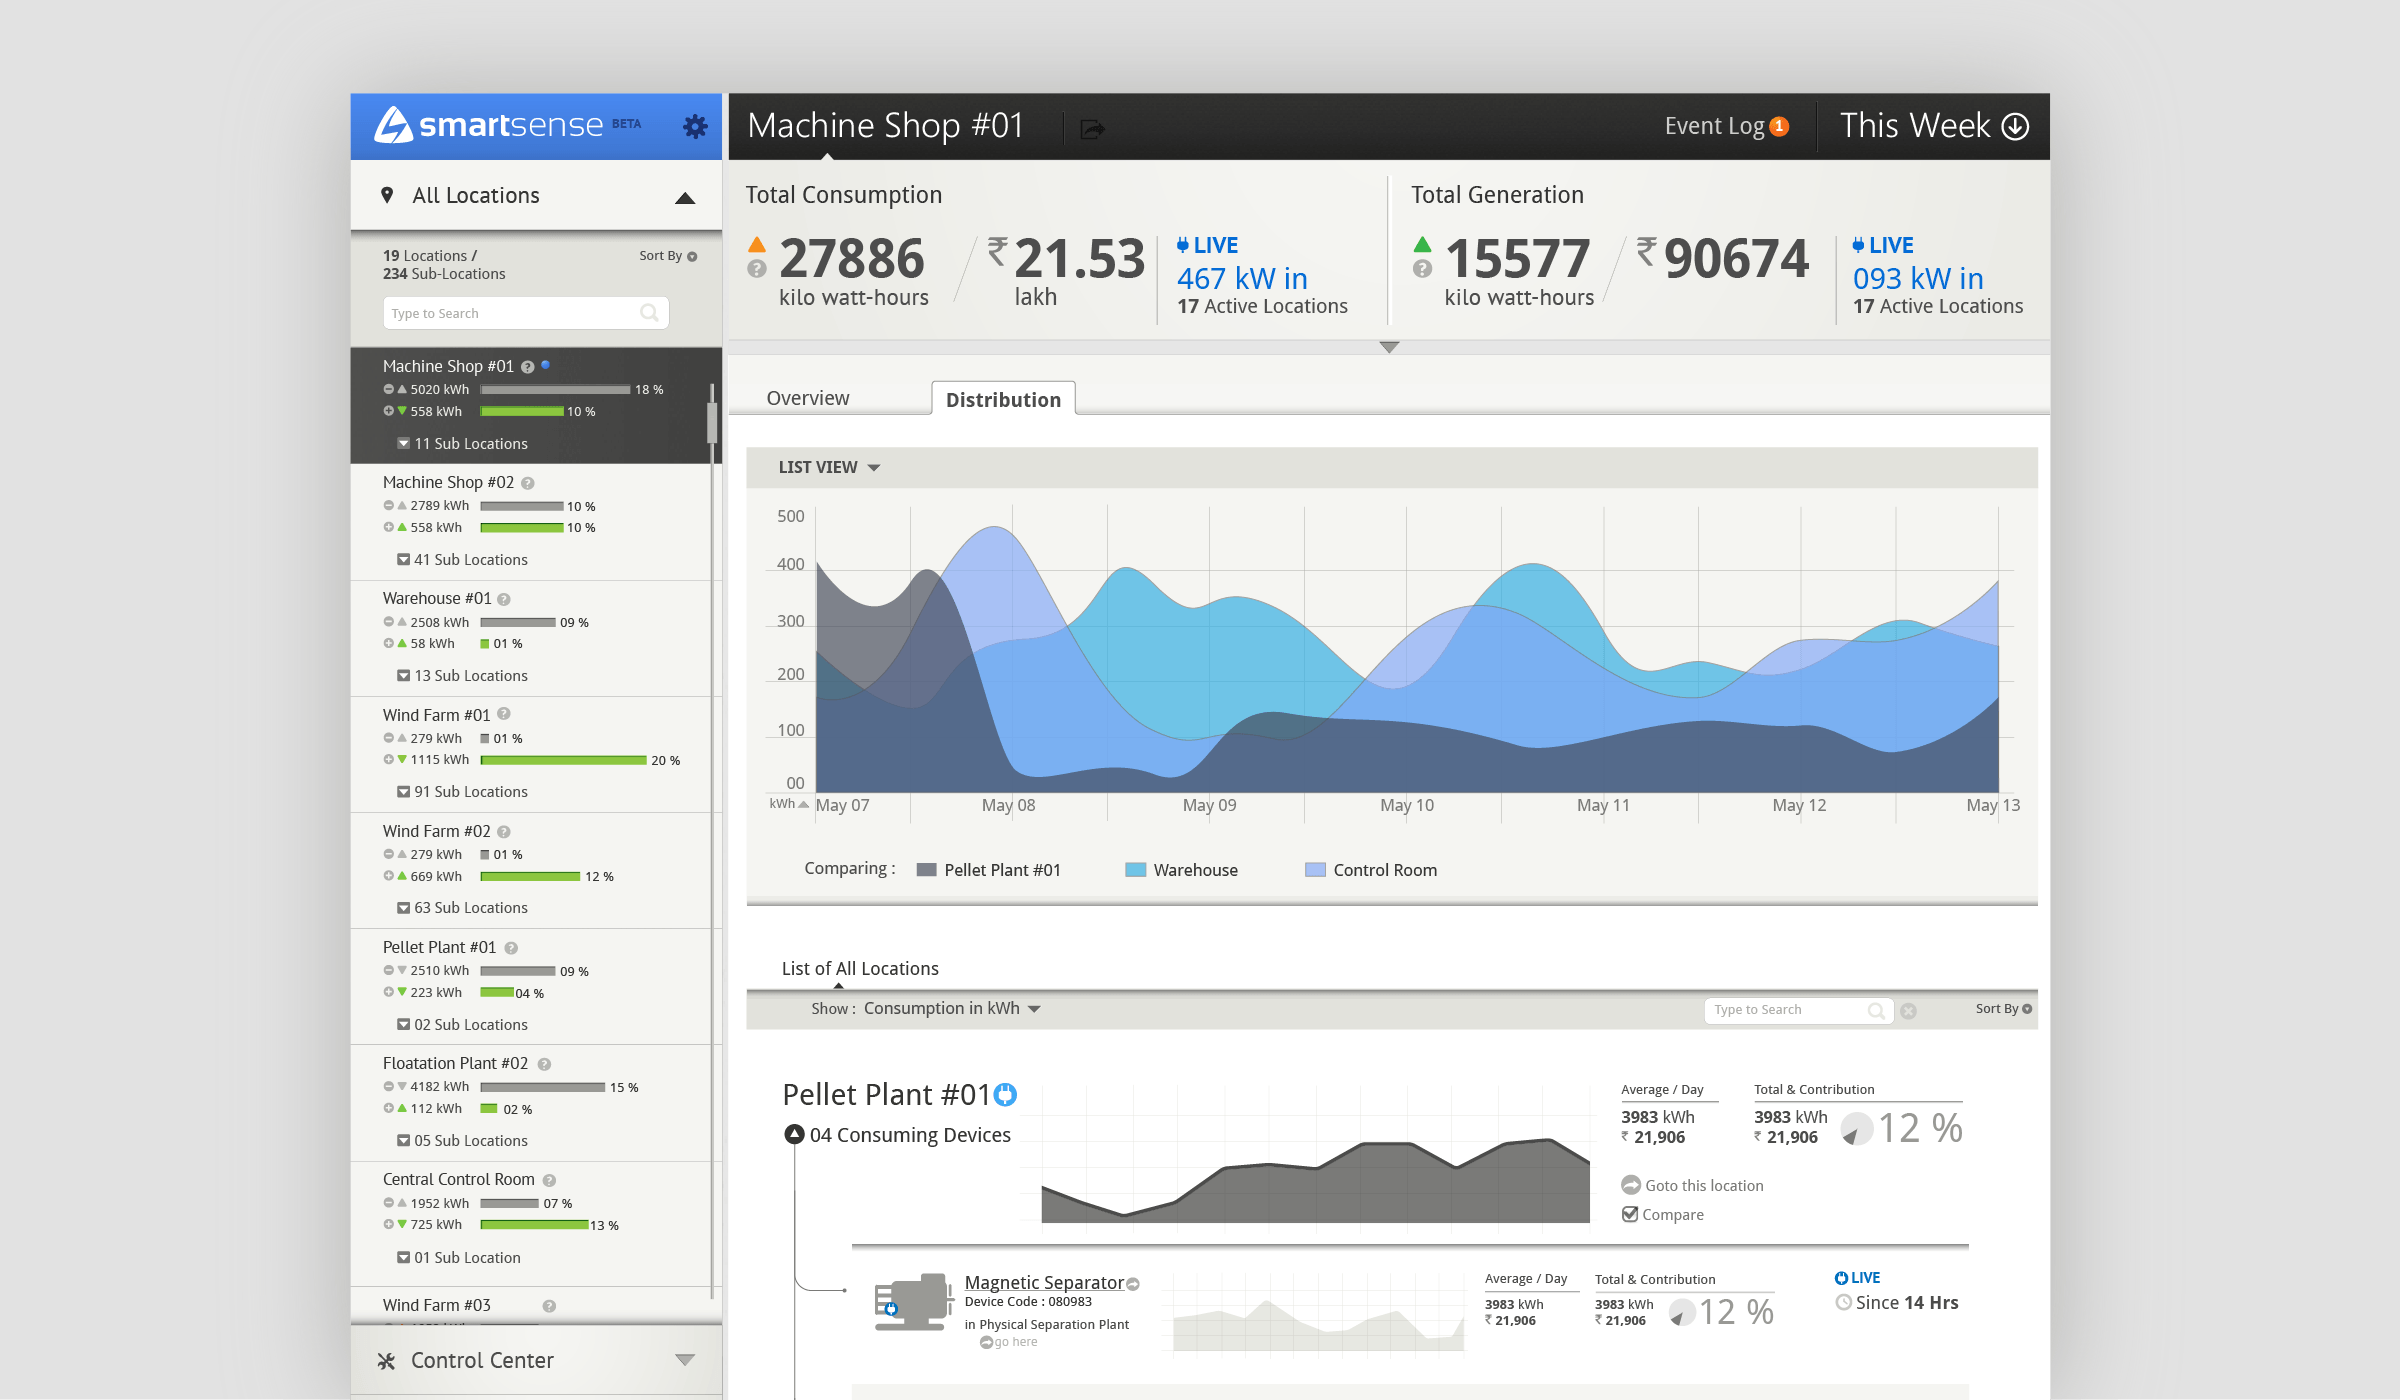
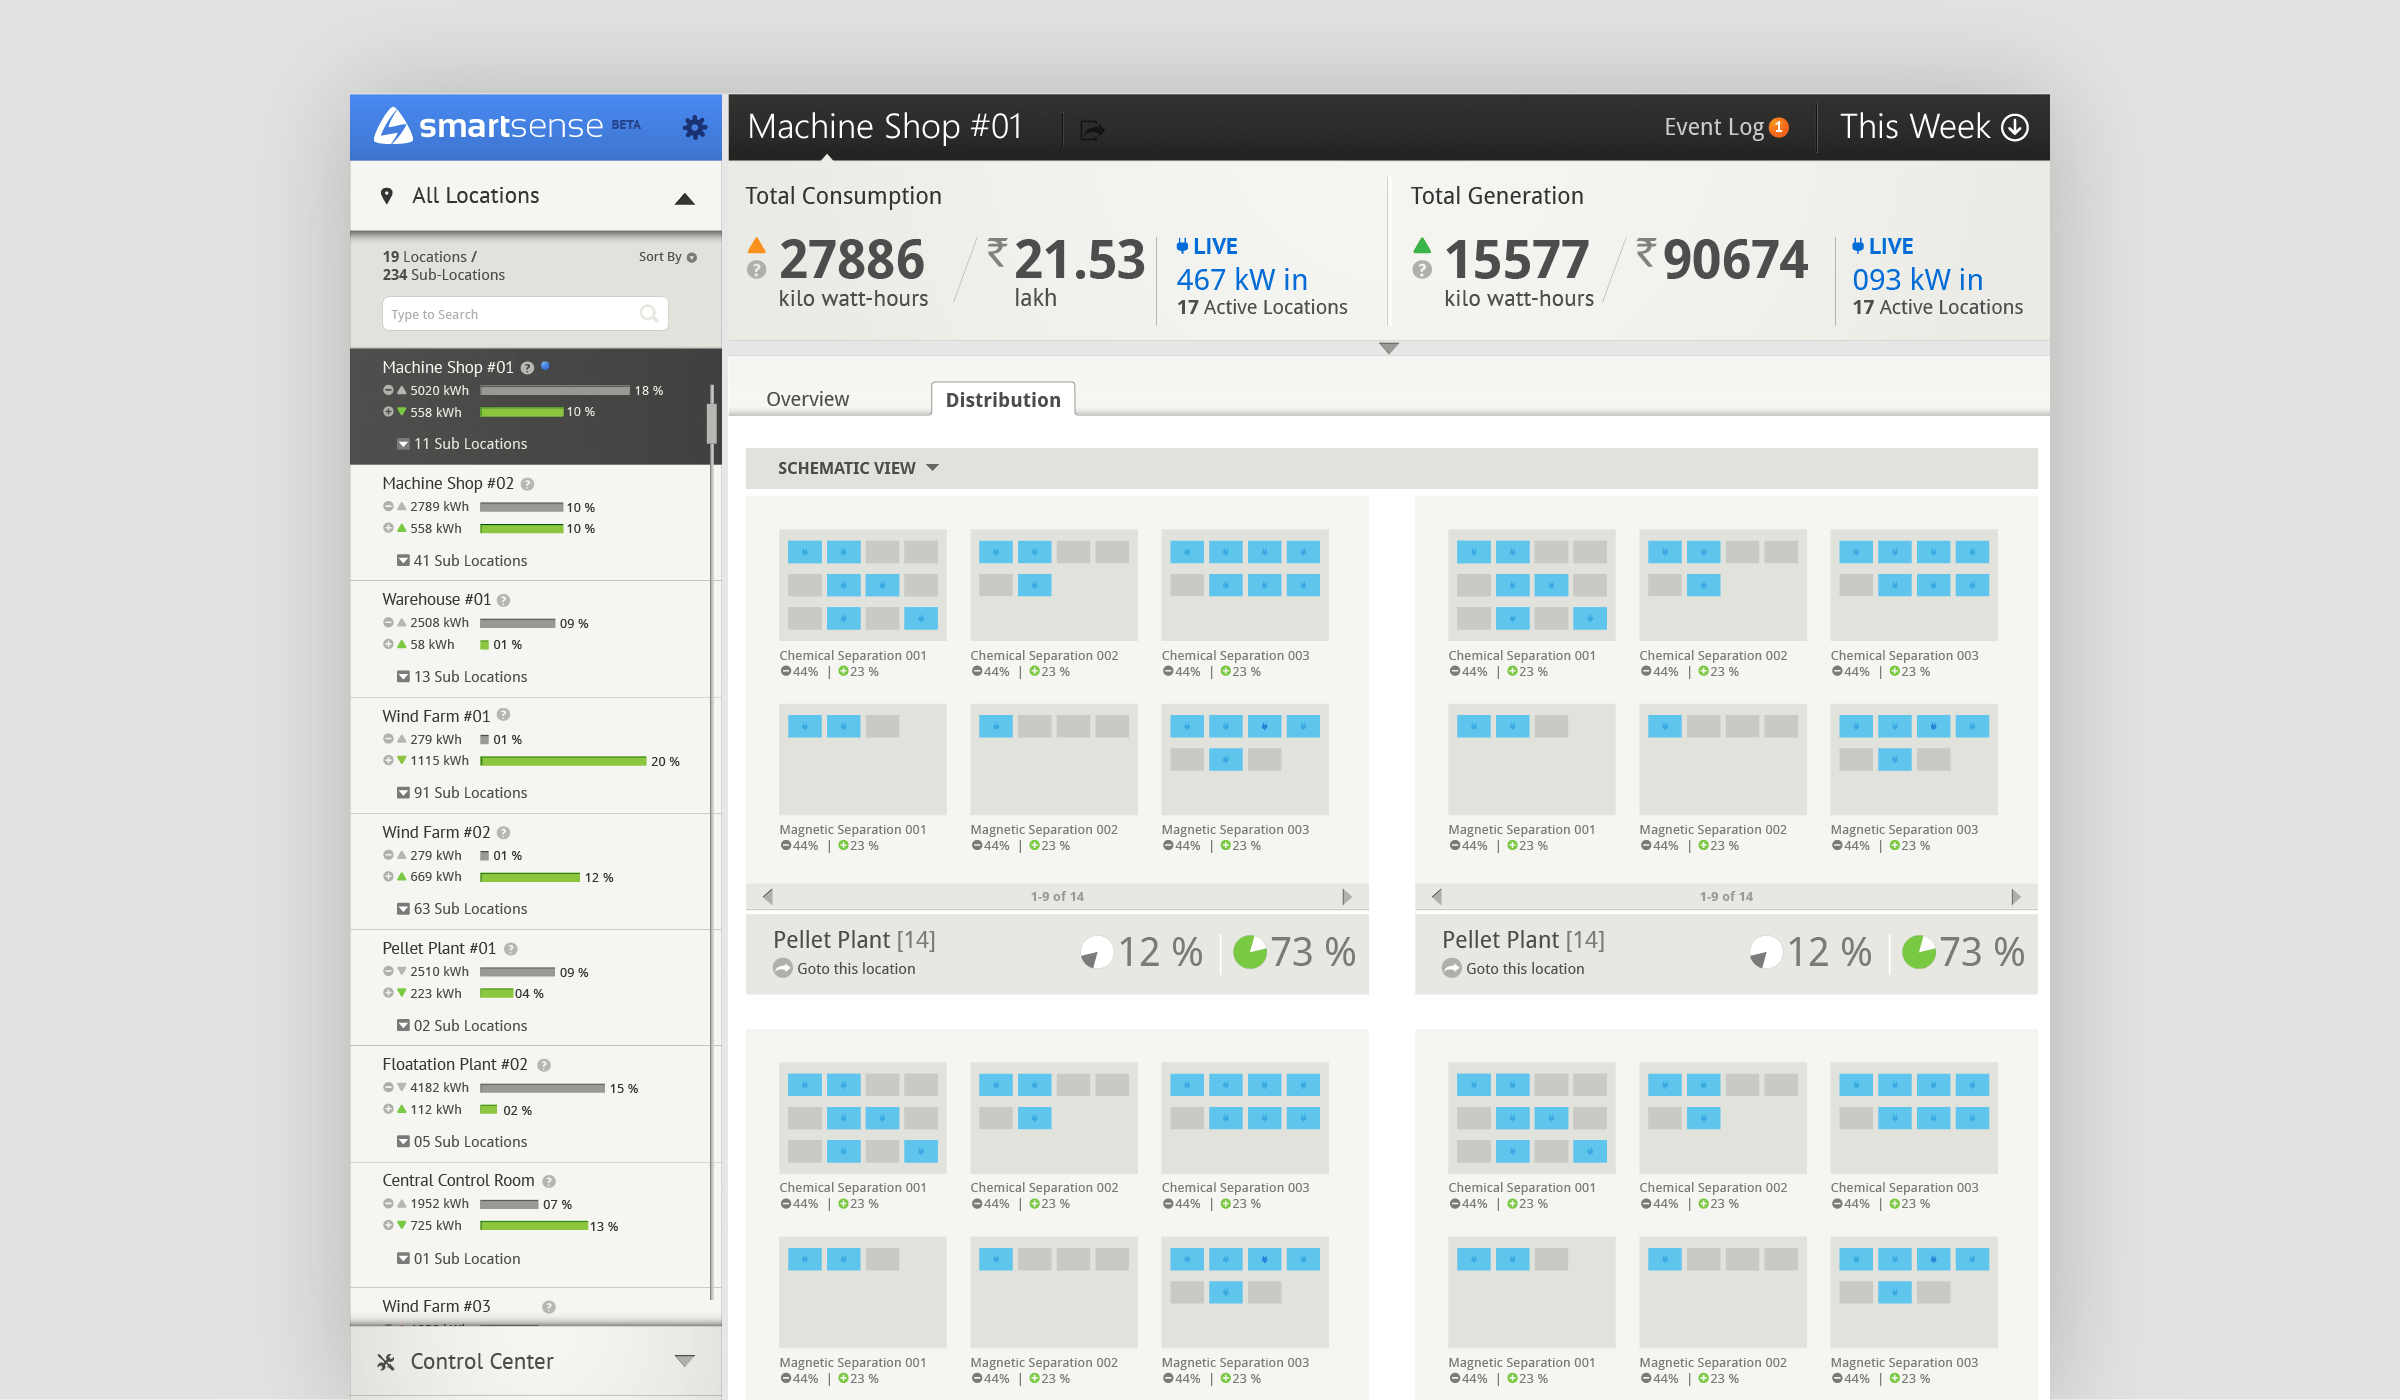
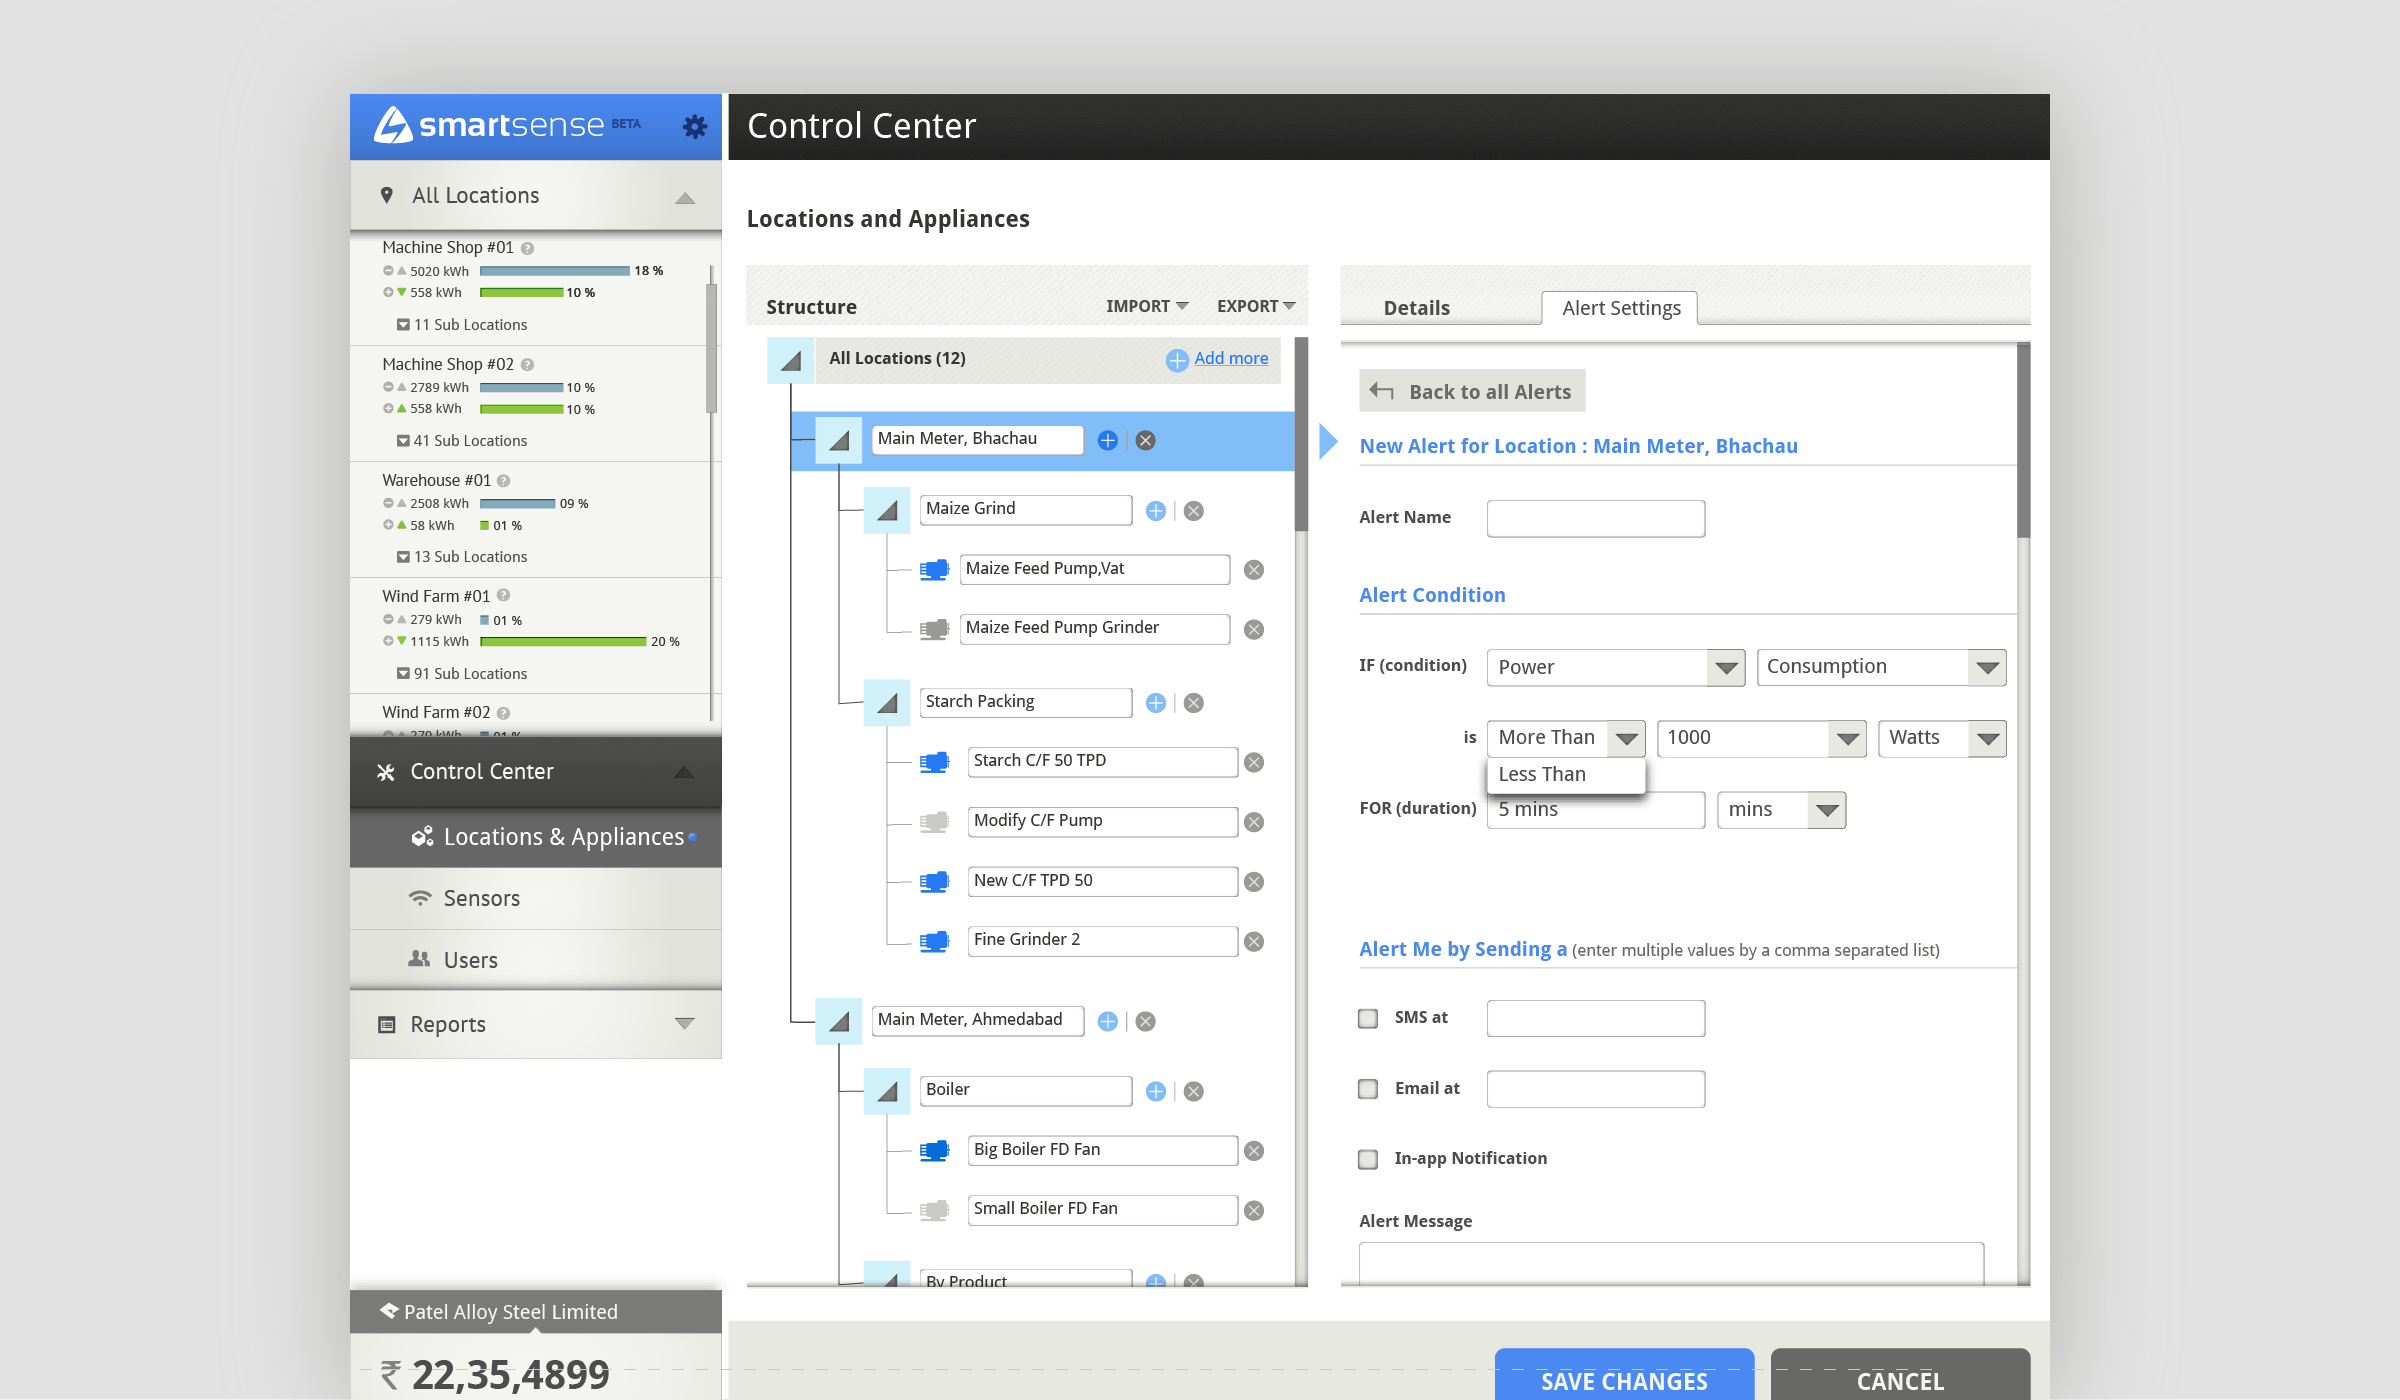
SmartSense User Interface, enabling users to navigate between different sub-systems of their establishments and identify patterns / anomalies in power consumption.
Windows app to visualize power consumption patterns. Using built-in gestures to perform meaningful and natural interactions
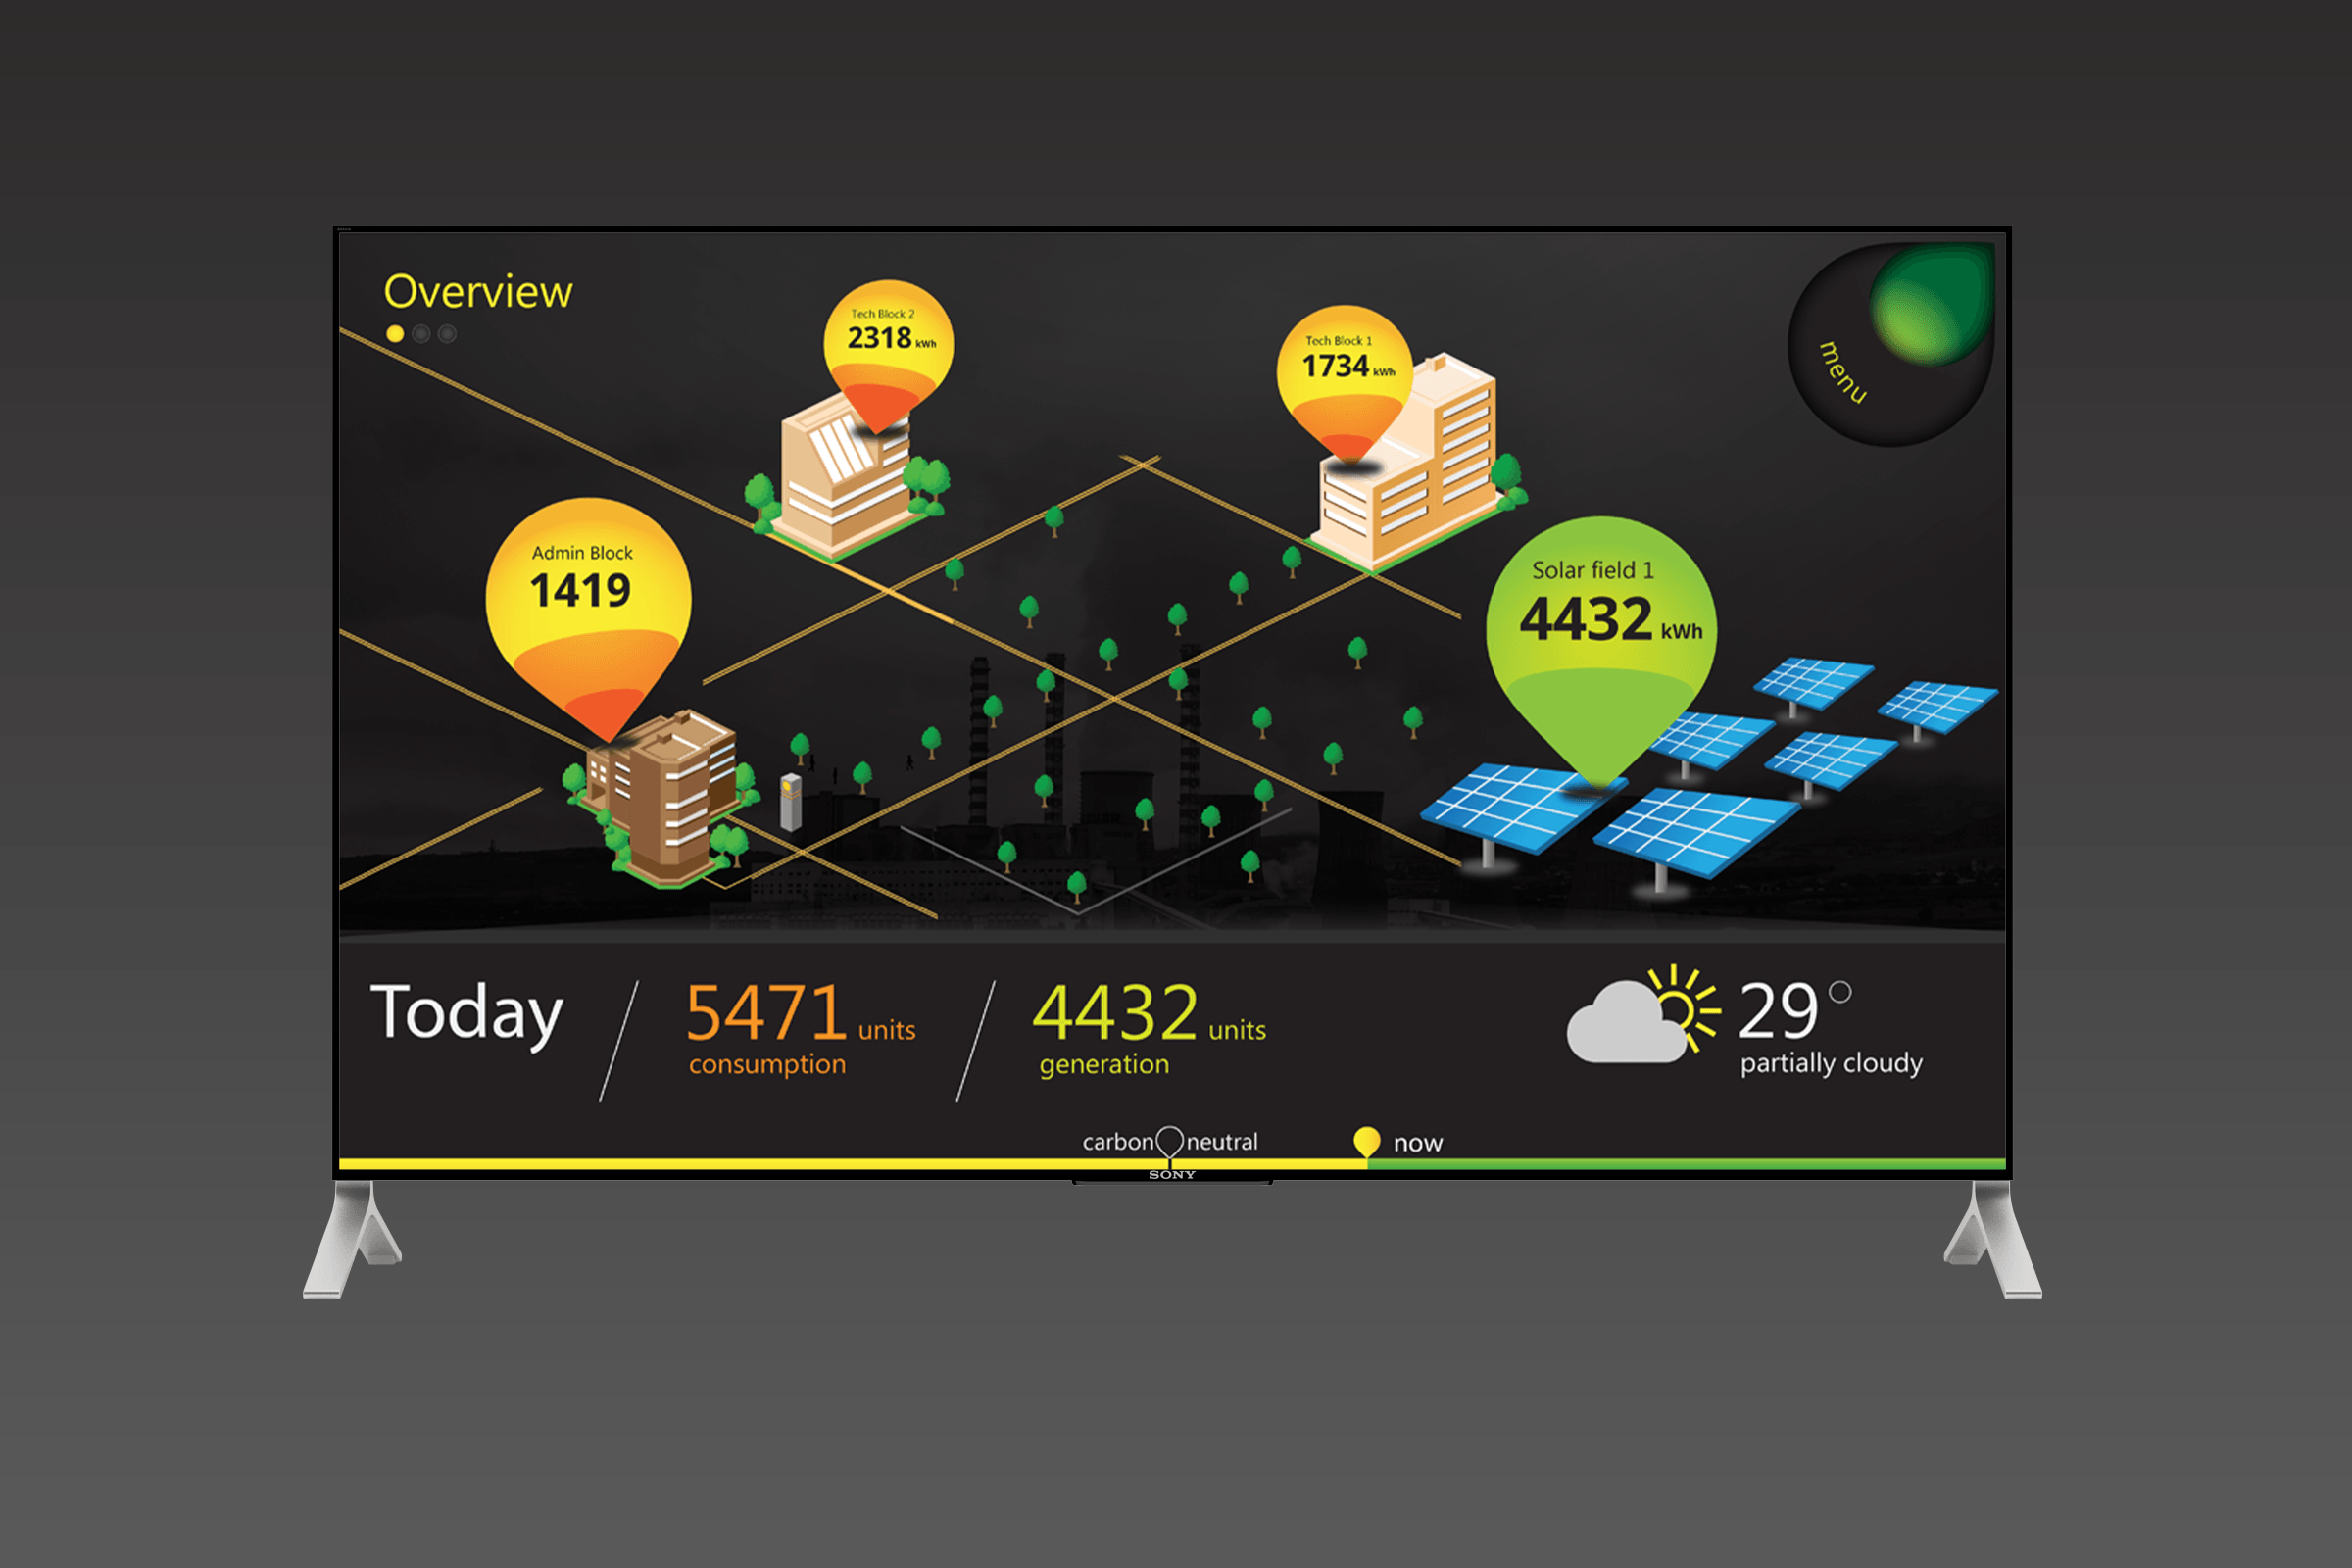
A concept showing the visualisation of power consumption and generation in an industrial establishment on a large touch interface
SmartSense for the power utility company, a map based interface to track, manage and offer demand response programs to their customers